Cart Abandonment
Add-to-Cart Rate: Definition, Formula, and Optimization Tips
Learn what add-to-cart rate is, how to calculate it, and strategies to improve it. Discover how Nudge can help improve your ecommerce conversions.

Gaurav Rawat


Why do thousands of visitors view your products, but so few take the next step toward buying? For many ecommerce marketers, this gap between traffic and transactions is the biggest barrier to growth. It signals that users are interested but not convinced, and the most telling metric that captures this hesitation is your add to cart rate.
In 2025, the shopping cart abandonment rate is 70.19%, showing that a significant portion of potential sales is being lost at the final stage of the buying process. For high-growth ecommerce and DTC brands, improving this rate can greatly improve conversions, increase average order value, and reduce acquisition costs.
In this article, you will learn what add-to-cart rate means, how to calculate it correctly, and proven strategies to optimize it for consistent revenue growth.
Key Takeaways
The add-to-cart rate measures how effectively your site turns browsing into purchase intent.
It is calculated by dividing sessions with add-to-cart actions by total sessions, multiplied by 100.
A 70.19% shopping cart abandonment rate highlights opportunities for improvement across industries.
Key factors influencing this rate include product appeal, website design, traffic quality, and trust signals.
Optimizing product pages, improving website speed, and utilizing social proof can increase your add-to-cart rate.
Nudge can help by offering real-time personalization, contextual nudges, and AI-driven product recommendations to increase conversions.
What Is Add-to-Cart Rate?
The add-to-cart rate measures the percentage of website visitors who place at least one product in their shopping cart. It reflects how successfully your product pages, design, and messaging inspire shoppers to take the first step toward checkout.
A strong add-to-cart rate signals high product appeal and persuasive presentation. A low one often means unclear pricing, poor imagery, or mismatched traffic. In short, it's your mid-funnel metric: the bridge between curiosity and conversion.
Example: If 10,000 visitors land on your site and 800 add items to their carts, your add-to-cart rate is 8%. It doesn't measure purchases yet; it shows intent.
Pro Tip: Track this rate by traffic source (e.g., TikTok vs Google Ads). If social traffic shows lower add-to-cart actions, your landing pages might not match ad expectations.
Your next step is understanding how to calculate this metric consistently and accurately.
How to Calculate Add-to-Cart Rate
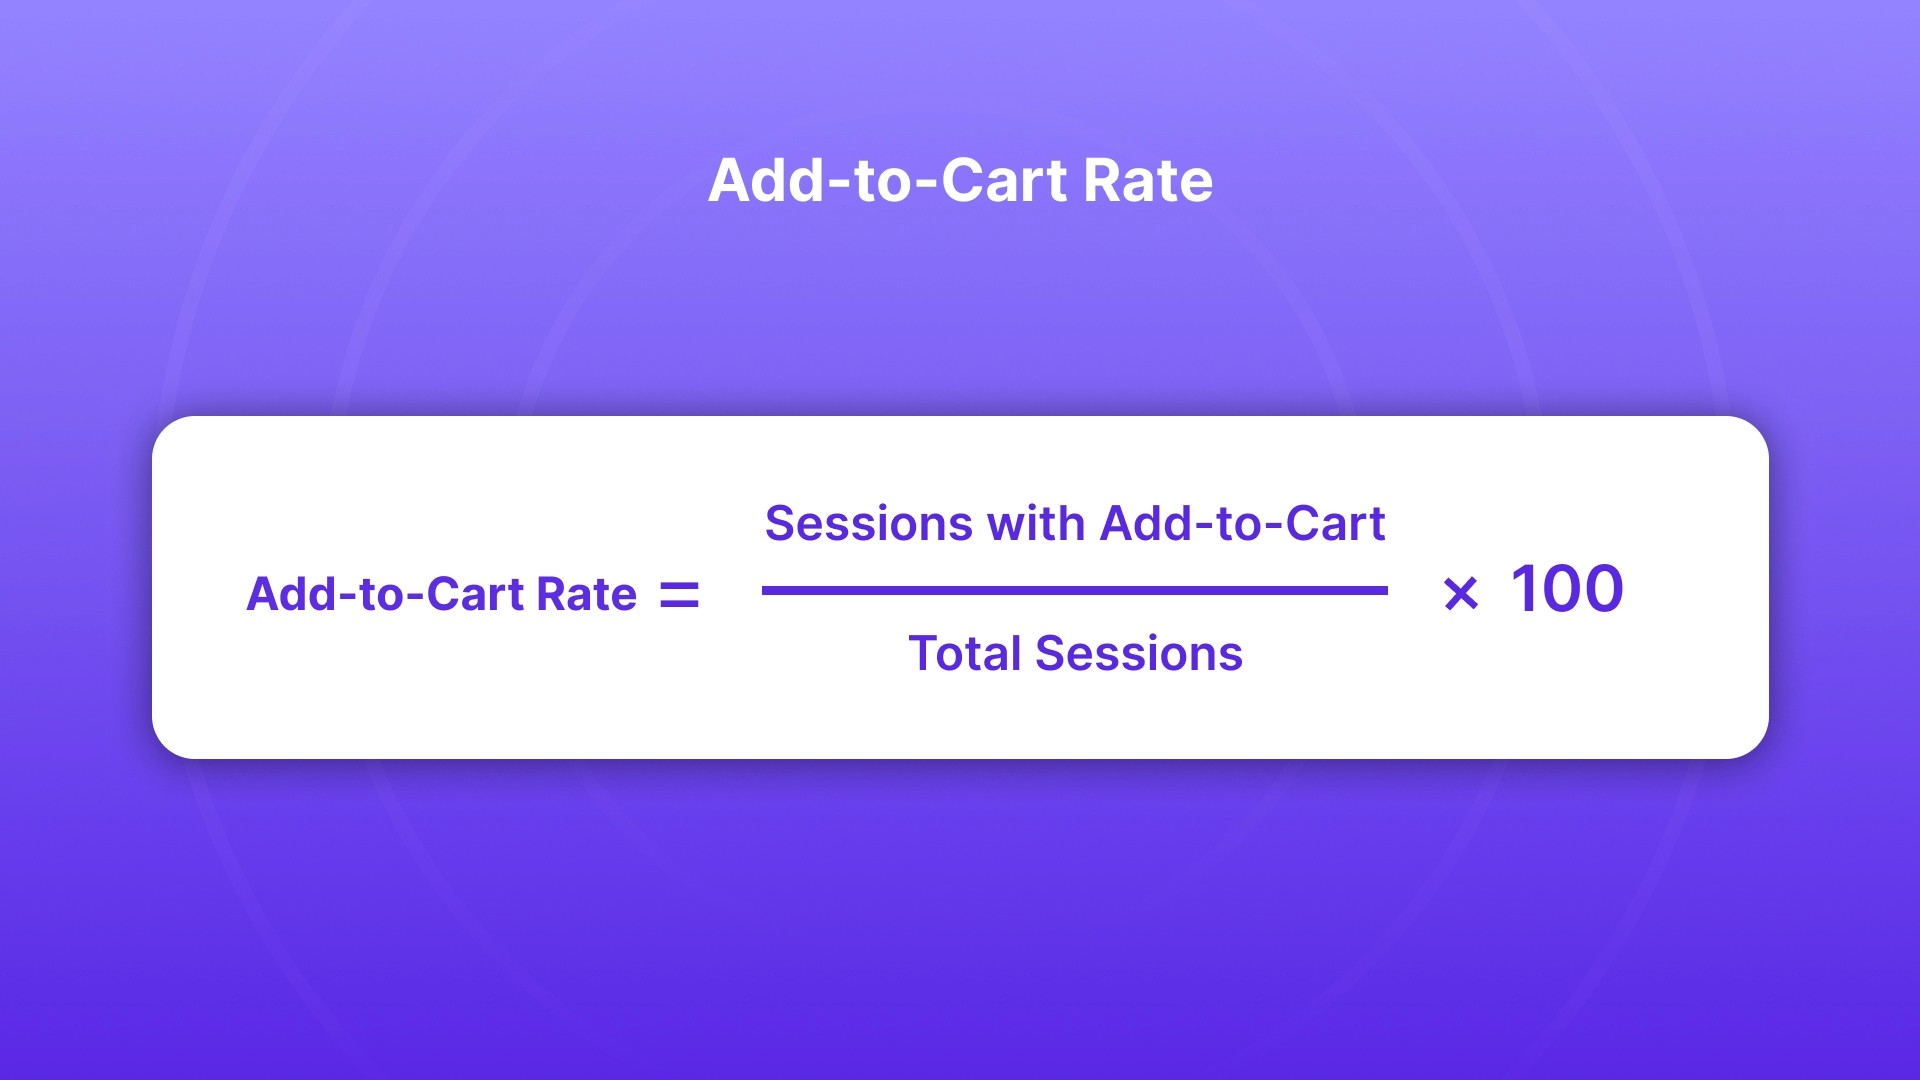
Understanding how to measure your add to cart rate accurately is essential before you can improve it. This metric reflects the proportion of browsing sessions where shoppers add at least one item to their cart.
When calculated correctly, it helps you identify how well your website turns product views into purchase intent, a critical insight for marketers managing paid and organic traffic.
The formula is simple:
Add-to-Cart Rate = (Sessions with Add-to-Cart ÷ Total Sessions) × 100
Example:
If your website receives 20,000 sessions in a month and 1,600 of those include an add-to-cart action, your add-to-cart rate would be (1,600 ÷ 20,000) × 100 = 8%.
This means 8% of all browsing sessions converted into a sign of buying intent.
To keep this calculation reliable, maintain consistent tracking parameters such as timeframe, session count, and attribution model. Platforms like Shopify Analytics and GA4 can help isolate these data points precisely.
Pro Tip: Use session-based tracking rather than user-based tracking to avoid inflating results. If a single visitor adds multiple items within one session, count it as one add-to-cart event to measure intent accurately rather than volume.
Platforms like Nudge personalize every surface of the shopping experience from the landing page to the cart, helping ensure the entire journey drives purchase intent and not just traffic.

Consistent calculation allows you to compare performance across campaigns and time periods. Once you know how to measure it correctly, the next step is understanding what a good add-to-cart rate looks like for your industry.
What Is a Good Add-to-Cart Rate? (Benchmarks)
When assessing your add-to-cart rate, it's important to benchmark your performance against industry standards. While the global average add-to-cart rate is around 7.9%, rates can vary greatly by industry. Understanding these variations helps you set realistic goals and identify areas for improvement in your ecommerce strategy.
Here's a breakdown of add-to-cart conversion rates by industry:
Industry | Add-to-Cart Conversion Rate |
Food & Beverage | 13.14% |
Beauty & Personal Care | 10.14% |
Fashion, Accessories, Apparel | 7.12% |
Consumer Goods | 5.98% |
Home & Furniture | 4.36% |
Multi-Brand Retail | 3.74% |
Pet Care & Veterinary Services | 3.49% |
Luxury & Jewelry | 3.23% |
While benchmarks are helpful, remember that your own traffic quality and marketing strategies should be the primary reference point. For example, fashion brands may see a higher add-to-cart rate compared to luxury jewelry, but their customer journey and buying process are vastly different.
Let's look at how to identify specific areas of your site that influence this rate and strategies for improving it.
Factors That Influence Add-to-Cart Rate
Several factors play a crucial role in shaping your add-to-cart rate. Understanding these elements can help you pinpoint what's causing friction in the shopper's journey and identify areas for improvement.
Factors Influencing Add-to-Cart Rate:
Product Attractiveness & Appeal: The visual and descriptive appeal of a product, including images, videos, and clear product benefits.
Website Usability & Design: The overall user experience, including easy navigation, fast load times, and mobile optimization.
Traffic Quality: The intent of visitors coming from different marketing channels, such as paid ads, social media, or organic search.
Trust & Social Proof: Elements like customer reviews, ratings, and guarantees that build shopper confidence.
Price & Discounts: Perceived value of the product in relation to its price, including the impact of sales, promotions, or special offers.
Funnel Friction: The ease with which users can navigate through the shopping process, including selecting product variants and completing the action of adding to the cart.
By understanding and monitoring these factors, you can gain insights into potential blockages. The next section will cover actionable strategies to optimize your add-to-cart rate based on these influencing factors.
Strategies to Improve Add-to-Cart Rate

Improving your add-to-cart rate requires more than just optimizing your product pages. It's about creating a seamless, engaging shopping experience that guides the customer from curiosity to intent.
Strategies to Improve Add-to-Cart Rate:
Optimize Product Pages: Use high-quality images, detailed descriptions, and clear product benefits to attract attention. For instance, 360-degree images offer shoppers a better sense of the product's details.
Improve Website Performance: Speed is crucial. A 0.1-second improvement in load time can increase conversions by 8% for retail sites. Ensure fast load times, mobile responsiveness, and clear navigation to enhance the user experience and drive more conversions.
Personalise User Experience: Personalize the shopping experience based on visitor behavior. Dynamic content and personalized recommendations can increase the likelihood of an item being added to the cart.
Use Social Proof: Include customer reviews, ratings, and testimonials to build trust and credibility. Display these elements near the "Add to Cart" button to influence decision-making.
Create Urgency: Use urgency tactics like "Only 3 left in stock" or "Limited time offer" to prompt quicker actions.
Simplify Checkout Process: A study shows that 18% of US online shoppers abandon their order due to a "too long or complicated checkout process." Reduce friction by offering guest checkout, clear shipping info, and one-click payments to ensure a smooth transition from cart to purchase.
Are you still facing high cart abandonment despite optimizing your product pages and website experience?
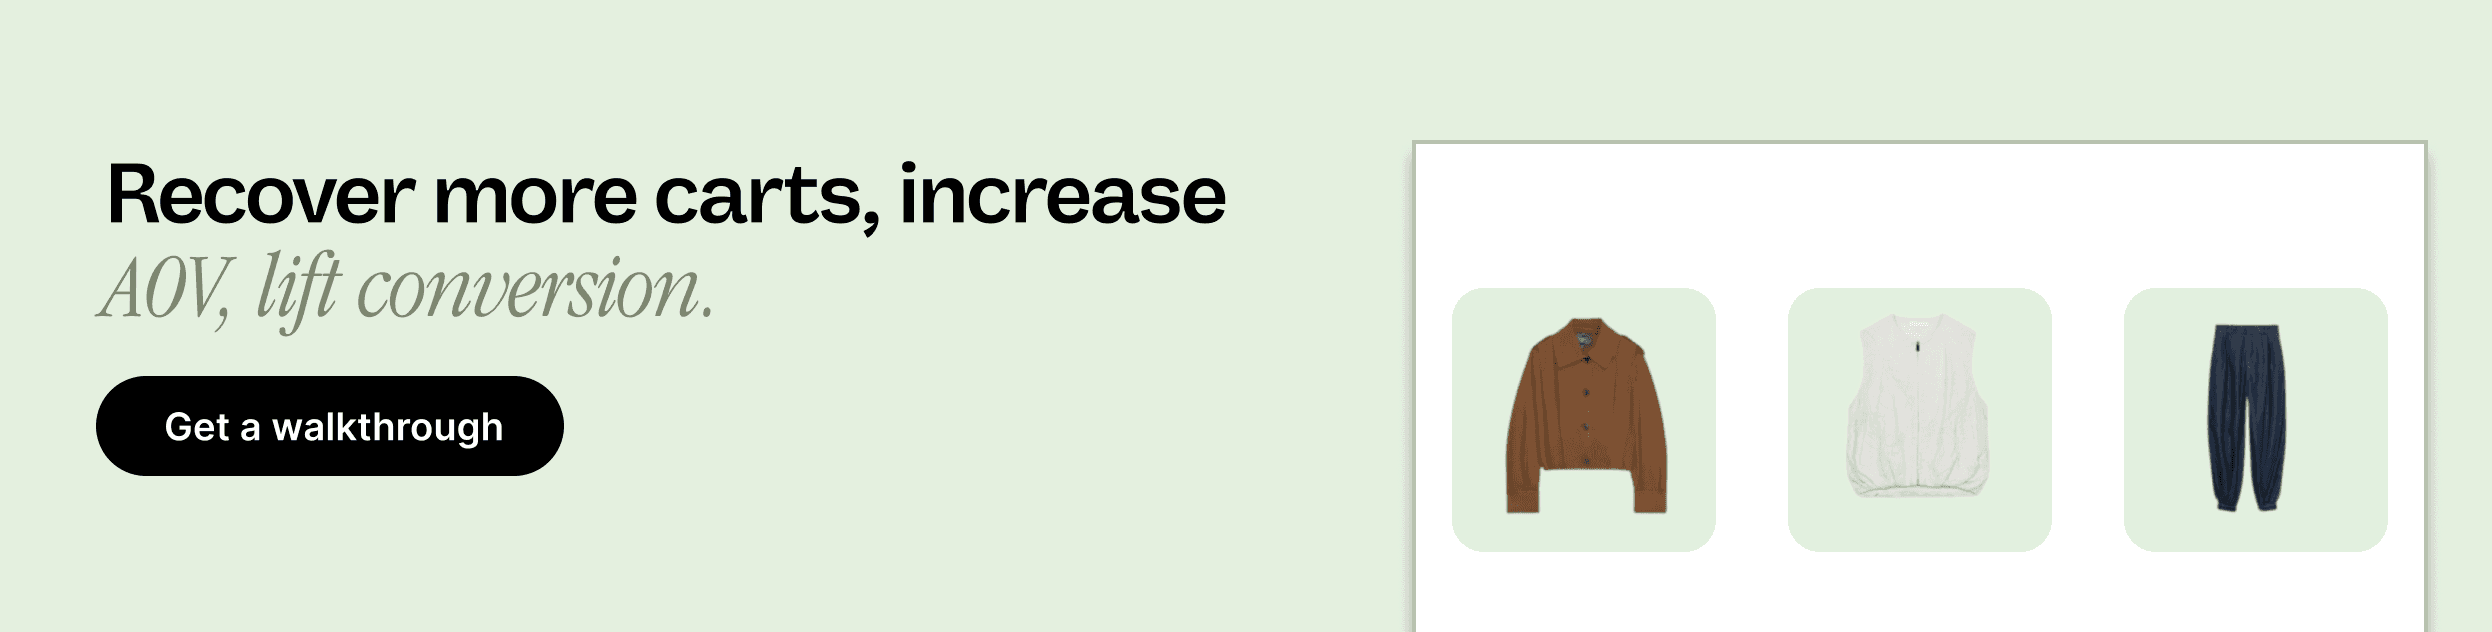
Nudge offers real-time AI-driven personalization that adapts your product pages, carts, and checkout to each shopper's behavior, helping you recover more abandoned carts, increase AOV, and increase conversions.
Once these strategies are in place, it's time to continuously track and analyze the performance of your add-to-cart rate to ensure you're getting the best possible results.
Analysing and Monitoring Add-to-Cart Performance
To effectively improve your add-to-cart rate, it's crucial to regularly monitor and analyze it. Using the right tools and methodologies helps you gain deeper insights into shopper behavior, identify friction points, and adjust your strategy to drive higher conversions.
Analyzing and Monitoring Add-to-Cart Rate:
Use Heatmaps and Session Analysis: Heatmaps and session recordings reveal where users are clicking and where they abandon the process. This helps pinpoint underperforming sections of your product pages or checkout process.
A/B Testing: Test different elements like page layouts, CTAs, and product descriptions to see what encourages more add-to-cart actions. Even small adjustments like adding urgency or social proof can significantly increase conversions.
Segment Performance by Source: Analyze performance based on traffic sources, such as paid ads, organic search, or social media. This provides insight into which channels drive the most engaged visitors and which need more optimization.
Track Device and Location: Segmenting by device and region helps you understand differing user behaviors across mobile and desktop. Mobile users, for example, may need a streamlined experience to increase their add-to-cart rate.
Monitor Trends Over Time: Continuously track trends in your add-to-cart rate to spot patterns or sudden shifts. A drop in rate could signal issues like slower page load times or changes in ad targeting, while steady growth suggests your optimization strategies are working.
By continuously tracking and optimizing your add-to-cart rate, you can identify areas of improvement. The next step is to use tools like Nudge to improve personalization, automate adjustments, and create personalized experiences that drive higher conversions.
How Can Nudge Help You Lift Add-to-Cart Rates?
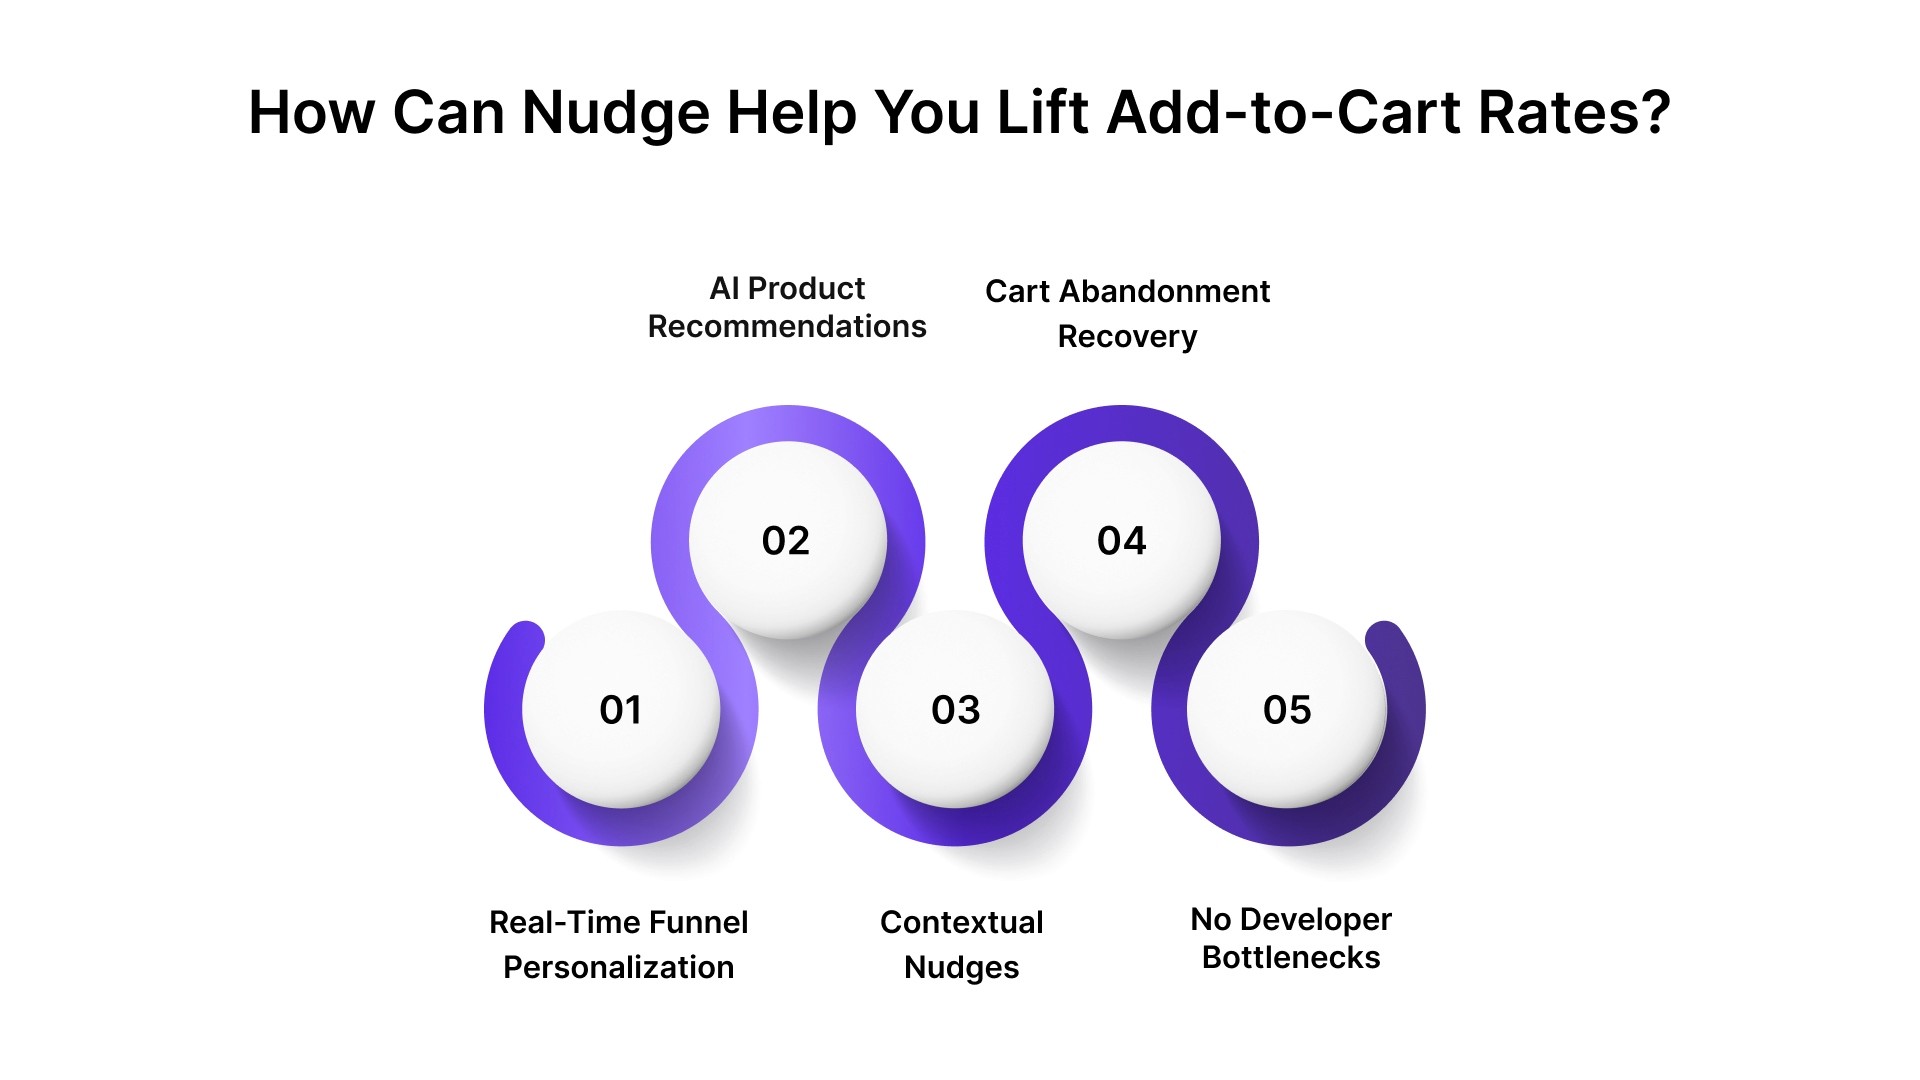
Nudge is an AI-powered platform that helps ecommerce brands personalize the shopping experience across the entire customer journey. By adapting product pages, carts, and checkout flows to each shopper's behavior and intent, Nudge improves engagement and encourages higher add-to-cart rates.
How Nudge Can Help Lift Your Add-to-Cart Rate:
Real-Time Personalization Across the Funnel: Instantly adapt homepage, PDPs, and cart pages to match shopper behavior, campaign source, and intent, increasing the chances of adding products to the cart.
AI Product Recommendations: Display context-aware recommendations and smart bundles on PDPs and carts, helping shoppers discover complementary items that increase cart value.
Contextual Nudges: Trigger dynamic banners or pop-ups based on user behavior (like exit intent or time on page), encouraging last-minute additions before leaving the site.
Cart Abandonment Recovery: Use personalized nudges or offers to re-engage shoppers who have abandoned their carts, encouraging them to complete their purchase and increase the add-to-cart rate.
No Developer Bottlenecks: Marketers can launch and iterate personalized experiences independently, making it faster to experiment and refine strategies that increase add-to-cart rates.

By using Nudge's powerful real-time personalization and AI-driven features, you can effectively increase your add-to-cart rate and drive greater conversions across your ecommerce site.
Read Next: 10 Proven Tips for Increasing Add to Cart Conversion Rates
Wrapping Up
The add-to-cart rate is a key indicator of shopper intent and site effectiveness. By calculating it correctly, benchmarking against industry standards, and optimizing key factors, you can greatly improve conversions.
Nudge offers real-time AI-driven personalization that personalizes every part of the shopping experience, helping ecommerce brands increase add-to-cart rates and drive more conversions.
Book a demo today to discover how Nudge can help you increase your add-to-cart rate and maximize revenue.
FAQs
1. What is a good add-to-cart rate benchmark?
A good add-to-cart rate varies by industry, but the global average is around 7.9%. For example, food & beverage brands often see rates around 13%, while fashion brands may see rates closer to 7–10%. Always benchmark against industry standards for realistic goals.
2. How can you increase the add-to-cart rate?
Improve product pages with high-quality images and clear pricing, optimize website performance, personalize the shopping experience, and simplify the checkout process to reduce friction.
3. How does personalization impact add-to-cart rate?
Personalization increases relevance, making it easier for shoppers to find suitable products. Nudge uses AI to deliver dynamic recommendations and content, increasing shopper confidence. This leads to more add-to-cart actions and higher conversions.
4. How can I track my add-to-cart rate accurately across different devices?
Tracking the add-to-cart rate by device ensures you can identify potential issues that might exist on mobile versus desktop. Use tools like GA4 or Shopify Analytics, which allow you to segment data based on device type to get accurate insights.
5. What is the impact of a slow website on the add-to-cart rate?
A slow website can dramatically lower your add-to-cart rate. According to studies, a one-second page delay can reduce conversions by up to 7%, which translates into a significant loss in potential revenue.