CRO & Experimentation
How to Calculate Bounce Rate and Increase Conversions (2025)
Learn how to calculate bounce rate to understand user engagement. Explore proven strategies to reduce bounce rate and turn visitors into loyal customers.

Gaurav Rawat


You spend hours crafting the perfect ad, targeting the right audience, and driving clicks, only for visitors to leave your site within seconds. It's a common challenge for ecommerce marketers and growth managers who invest heavily in acquisition but see users drop off before engaging with a single product page.
A high bounce rate often reveals that something in your post-click experience isn't connecting with your audience. For example, Amazon.com has an average bounce rate of 36.44%, which indicates a significant drop-off before visitors engage with products. Every bounced visitor represents lost potential revenue, and understanding why it happens is the first step to fixing it.
In this article, you'll learn how to calculate bounce rate, interpret what it means for your store, and use personalization strategies to turn short visits into lasting conversions.
Key Takeaways
Bounce rate measures how many visitors leave your site without interacting, understanding that it helps identify where engagement drops.
In GA4, bounce rate is calculated as 100% minus engaged sessions, offering a more accurate view of user behavior.
You can lower bounce rate by improving page speed, aligning ad messaging, and delivering personalized experiences.
Track supporting metrics like engaged sessions, scroll depth, and conversion rate for deeper insight into user intent.
Nudge helps reduce bounce rate through real-time personalization, AI Product Recommendations, and Contextual Nudges that drive higher engagement and conversions.
What Is Bounce Rate?
Bounce rate measures the percentage of visitors who land on a page and leave without taking any further action. It's one of the simplest yet most misunderstood engagement metrics.
In Google Analytics, the formula is:
Bounce Rate = (Unengaged Sessions ÷ Total Sessions) × 100
If 400 out of 1,000 visitors leave after viewing only one page, your bounce rate is 40%.
A bounce doesn't always mean failure; for example, a visitor reading a single blog post may get all the information they need. But on ecommerce sites, a high bounce rate usually signals that your landing pages aren't meeting user expectations or motivating them to explore further.
Pro Tip: For ecommerce and DTC brands, think of bounce rate as a conversion insight metric rather than a performance flaw. It highlights where shoppers lose interest post-click, helping you identify exactly which pages need stronger relevance or personalization.
As measurement models grow, understanding how Google Analytics 4 (GA4) now defines and tracks bounce rate can help you interpret this metric more accurately.
Bounce Rate in Universal Analytics vs GA4
Bounce rate tracking has changed significantly in Google Analytics 4 (GA4), shifting from counting single-page sessions to measuring overall engagement quality. Understanding this difference is crucial to interpreting your website's performance accurately and to making smarter optimization decisions.
Here is a detailed comparison of Bounce Rate in Universal Analytics vs GA4:
Aspect | Universal Analytics (UA) | Google Analytics 4 (GA4) |
Definition | A session with only one pageview and no interaction. | A session where the user was not engaged (less than 10 seconds, no conversion, or only one pageview). |
Formula | (Single-page Sessions ÷ Total Sessions) × 100 | 100% – Engaged Sessions (%) |
Focus | Pageviews and interactions | User engagement and session quality |
Engagement Criteria | None beyond a single hit | Engaged if session ≥10s, triggers conversion, or views ≥2 pages |
Data Insight | Measures inactivity | Measures meaningful engagement |
Relevance for Marketers | Useful but limited view of behavior | Provides deeper understanding of how users interact before leaving |
This shift reframes bounce rate from being a surface-level traffic metric to a deeper indicator of how effectively your pages engage users. With this, it becomes essential to understand exactly how to calculate bounce rate using GA4's updated framework.
How to Calculate Bounce Rate (Step-by-Step)
Knowing how to calculate bounce rate helps you quantify how many visitors leave your site without engaging further, a crucial indicator of post-click performance. The formula is simple, but what makes it powerful is how you interpret it across pages, campaigns, and user intent.
Let's break it down step by step with a real ecommerce example.
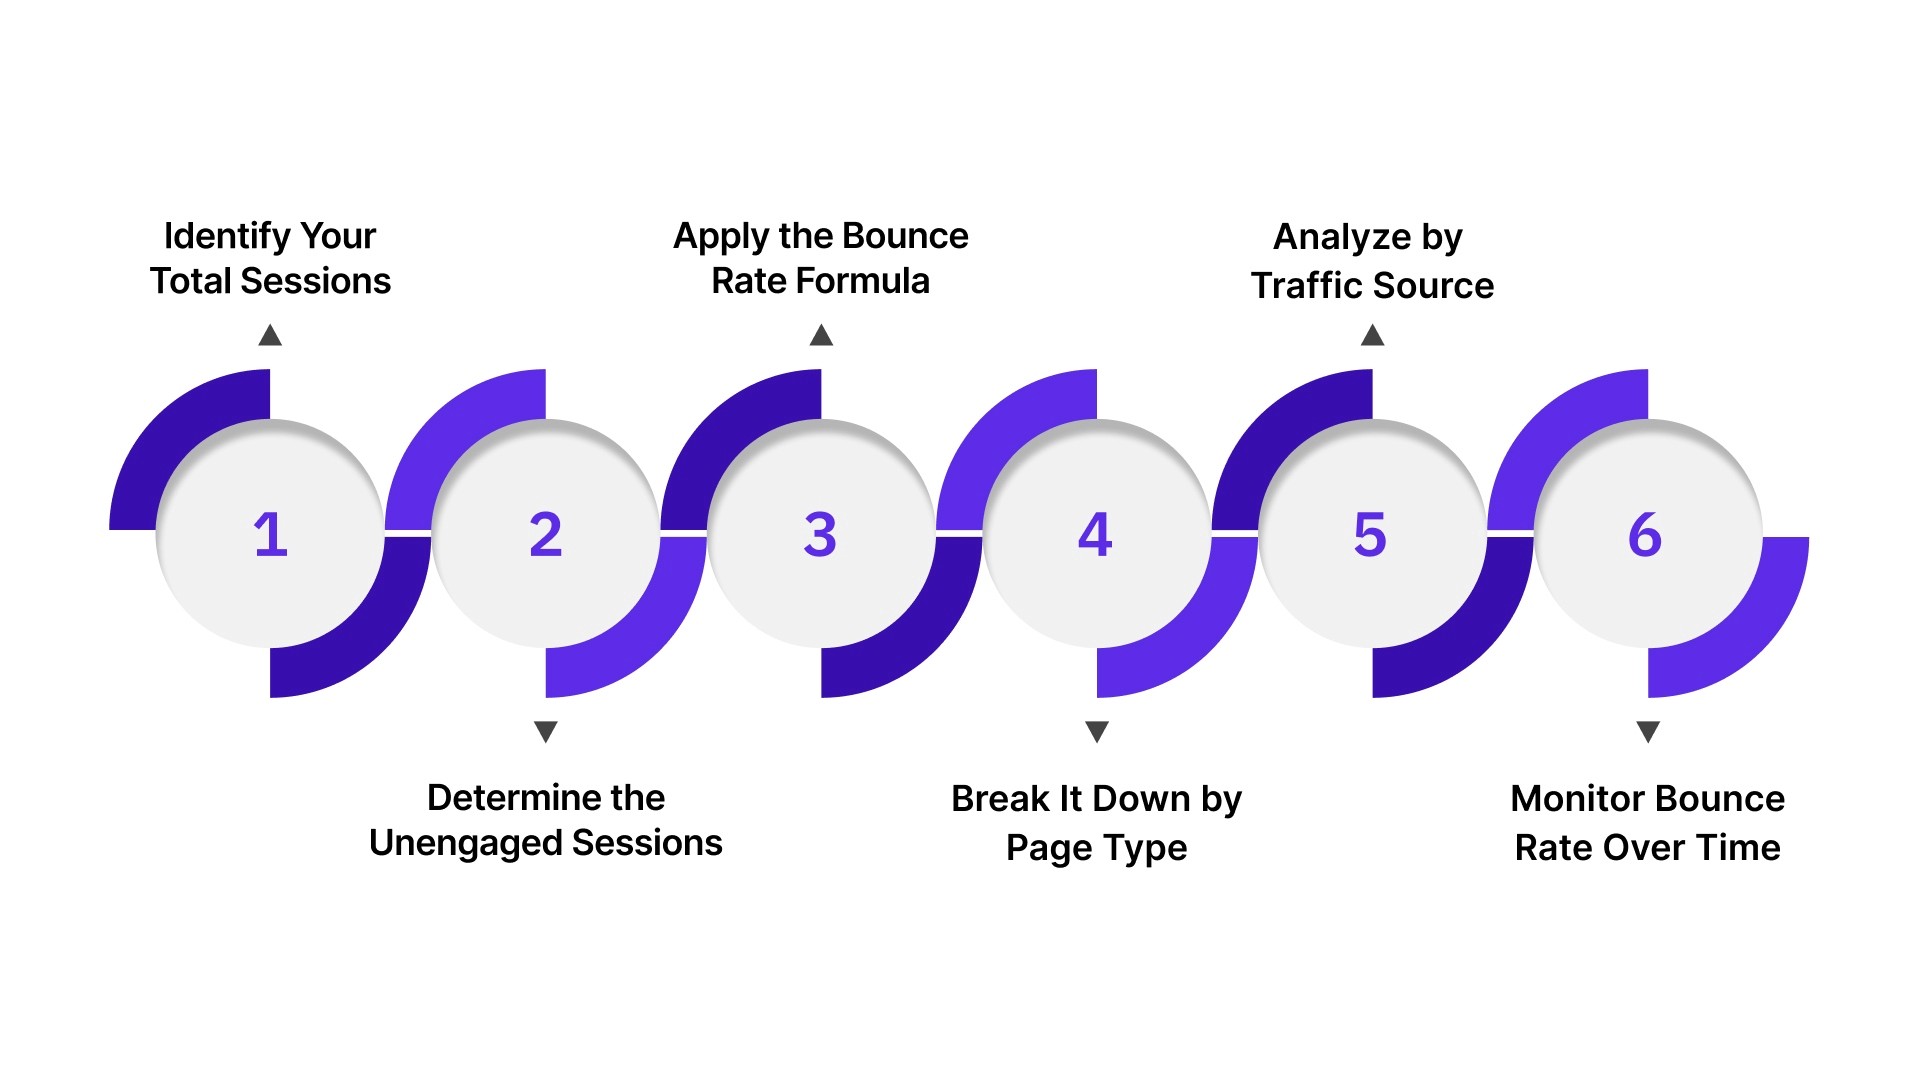
Step 1: Identify Your Total Sessions
Start by looking at how many total visits your website received in a specific time frame.
Example: Your online fashion store recorded 10,000 total sessions in June.
This number represents all the visits, every time someone lands on your site, whether they stay or leave instantly.
Step 2: Determine the Unengaged Sessions
Unengaged sessions are visitors who leave after viewing only one page, spend less than 10 seconds, or perform no meaningful action (like adding to cart or clicking a link).
Example: Out of 10,000 total sessions, analytics shows 4,000 unengaged sessions, meaning 4,000 people bounced without any further interaction.
Why it matters: This group represents the lost engagement potential, i.e, people who were interested enough to click your ad or search result but didn't find what they expected once they arrived.
Step 3: Apply the Bounce Rate Formula
Use the standard formula to calculate bounce rate:
Bounce Rate = (Unengaged Sessions ÷ Total Sessions) × 100
Plug in the numbers:
Bounce Rate = (4,000 ÷ 10,000) × 100 = 40%
This means 40% of visitors left your site without taking any further action.
A 40% bounce rate isn't bad; context is everything. If this is your homepage or a blog post, that might be acceptable. But if it's your main product page or a campaign landing page, it signals a disconnect between user expectations and page experience.
Step 4: Break It Down by Page Type
Calculating an overall bounce rate gives you a big-picture view, but breaking it down by page type helps pinpoint where visitors lose interest.
Page Type | Total Sessions | Unengaged Sessions | Bounce Rate Calculation | Bounce Rate |
Landing Page | 3,000 | 1,500 | (1,500 ÷ 3,000) × 100 | 50% |
Product Page (PDP) | 5,000 | 1,500 | (1,500 ÷ 5,000) × 100 | 30% |
Checkout Page | 2,000 | 400 | (400 ÷ 2,000) × 100 | 20% |
In this example, the landing page has the highest bounce rate (50%), meaning half the visitors left without exploring products. That's where optimization, better messaging, faster load times, or personalized recommendations can make a measurable difference.
Step 5: Analyze by Traffic Source or Campaign
Not all traffic behaves the same. Segment your bounce rate by source (paid, organic, social, email) or by specific campaigns.
Example:
Facebook Ads: 5,000 sessions, 3,000 unengaged → (3,000 ÷ 5,000) × 100 = 60% bounce rate
Organic Search: 3,000 sessions, 900 unengaged → (900 ÷ 3,000) × 100 = 30% bounce rate
This tells you your paid campaigns might be overpromising in ad creative or misaligned with the landing page content, a common issue in ecommerce marketing.
Pro Tip: If your bounce rate from paid ads is double that of organic traffic, revisit your ad copy, audience targeting, and landing page continuity.
Step 6: Monitor Bounce Rate Trends Over Time
Tracking bounce rate week over week or month over month helps you understand whether your site changes improve engagement.
Example:
May bounce rate: 46%
June bounce rate: 38%
That 8% drop means 800 more visitors (out of 10,000) stayed and interacted, a direct win for engagement and conversion potential.
Once you've calculated your bounce rate accurately, the real insight lies in what those numbers tell you. Understanding why users leave and what their behavior indicates about your site experience is where meaningful optimization begins.
Interpreting Bounce Rate: What the Numbers Mean
Once you've learned how to calculate bounce rate, the next step is understanding what those numbers actually reveal about your site's performance. Bounce rate isn't inherently good or bad; its meaning depends on page type, traffic quality, and user intent.
How to Interpret Bounce Rate:
Below 30% (Excellent): Visitors find your content relevant and stay to interact or browse multiple pages. This is common for loyal customers or well-optimized product journeys.
30% to 50% (Healthy Range): Your pages are performing well overall, but refining personalization or improving load speed can lift engagement further.
50% to 70% (Needs Improvement): Users may not be finding what they expect. Review your ad copy, landing page message alignment, and overall user flow.
Above 70% (High Risk): Indicates strong friction points, slow load times, poor targeting, or irrelevant landing experiences are driving visitors away almost instantly.
By Page Type: A 60% bounce rate on a blog may be acceptable since visitors often read and leave, but the same rate on a checkout or product page signals serious conversion loss.
By Traffic Source: Paid campaigns usually show higher bounce rates than organic or email traffic. Use this insight to refine targeting and improve landing page alignment.
By Device: Mobile bounce rates tend to be higher than desktop. Simplify navigation, speed up loading, and use responsive layouts to retain users on smaller screens.
Once you understand what your bounce rate represents, the next step is to take action. By optimizing your content, page experience, and personalization strategy, you can reduce bounce rates and turn those fleeting visits into meaningful conversions.
How to Reduce Bounce Rate and Increase Conversions
Reducing bounce rate begins with improving the relevance and quality of every visitor's first interaction. Your goal isn't to keep users on the page longer; it's to guide them naturally toward conversion by matching their intent, speeding up access, and personalizing what they see.
Practical Ways to Reduce Bounce Rate and Increase Conversions:
Match ad message to landing content: Make sure your page headline, visuals, and offer mirror what users clicked on. Mismatched messaging leads to immediate exits.
Optimize page speed: Compress media files, remove heavy scripts, and target a load time under 3 seconds for both mobile and desktop users.
Personalize content dynamically: Display location-based offers, product recommendations, or category highlights relevant to each visitor's behavior and campaign source.
Simplify your navigation: Reduce clutter, add clear CTAs, and limit decision fatigue to help users find what they came for faster.
Use engaging visuals and layout hierarchy: Hero banners, interactive elements, and contrast-driven CTAs guide the user's eye to conversion points.
Make checkout frictionless: Autofill details, offer guest checkout, and show trust signals to reduce abandonment.
Test continuously: A/B test layouts, CTA copy, and image placement to identify what keeps visitors interacting.
Optimize for mobile-first browsing: Ensure all interactive elements are easy to tap and that layouts resize perfectly for smaller screens.
Add contextual nudges: Trigger personalized pop-ups, banners, or offers when users hesitate or show exit intent to re-engage them.
Show credibility instantly: Use real customer reviews, testimonials, or guarantees above the fold to build immediate trust.
How can you apply these strategies quickly and at scale?
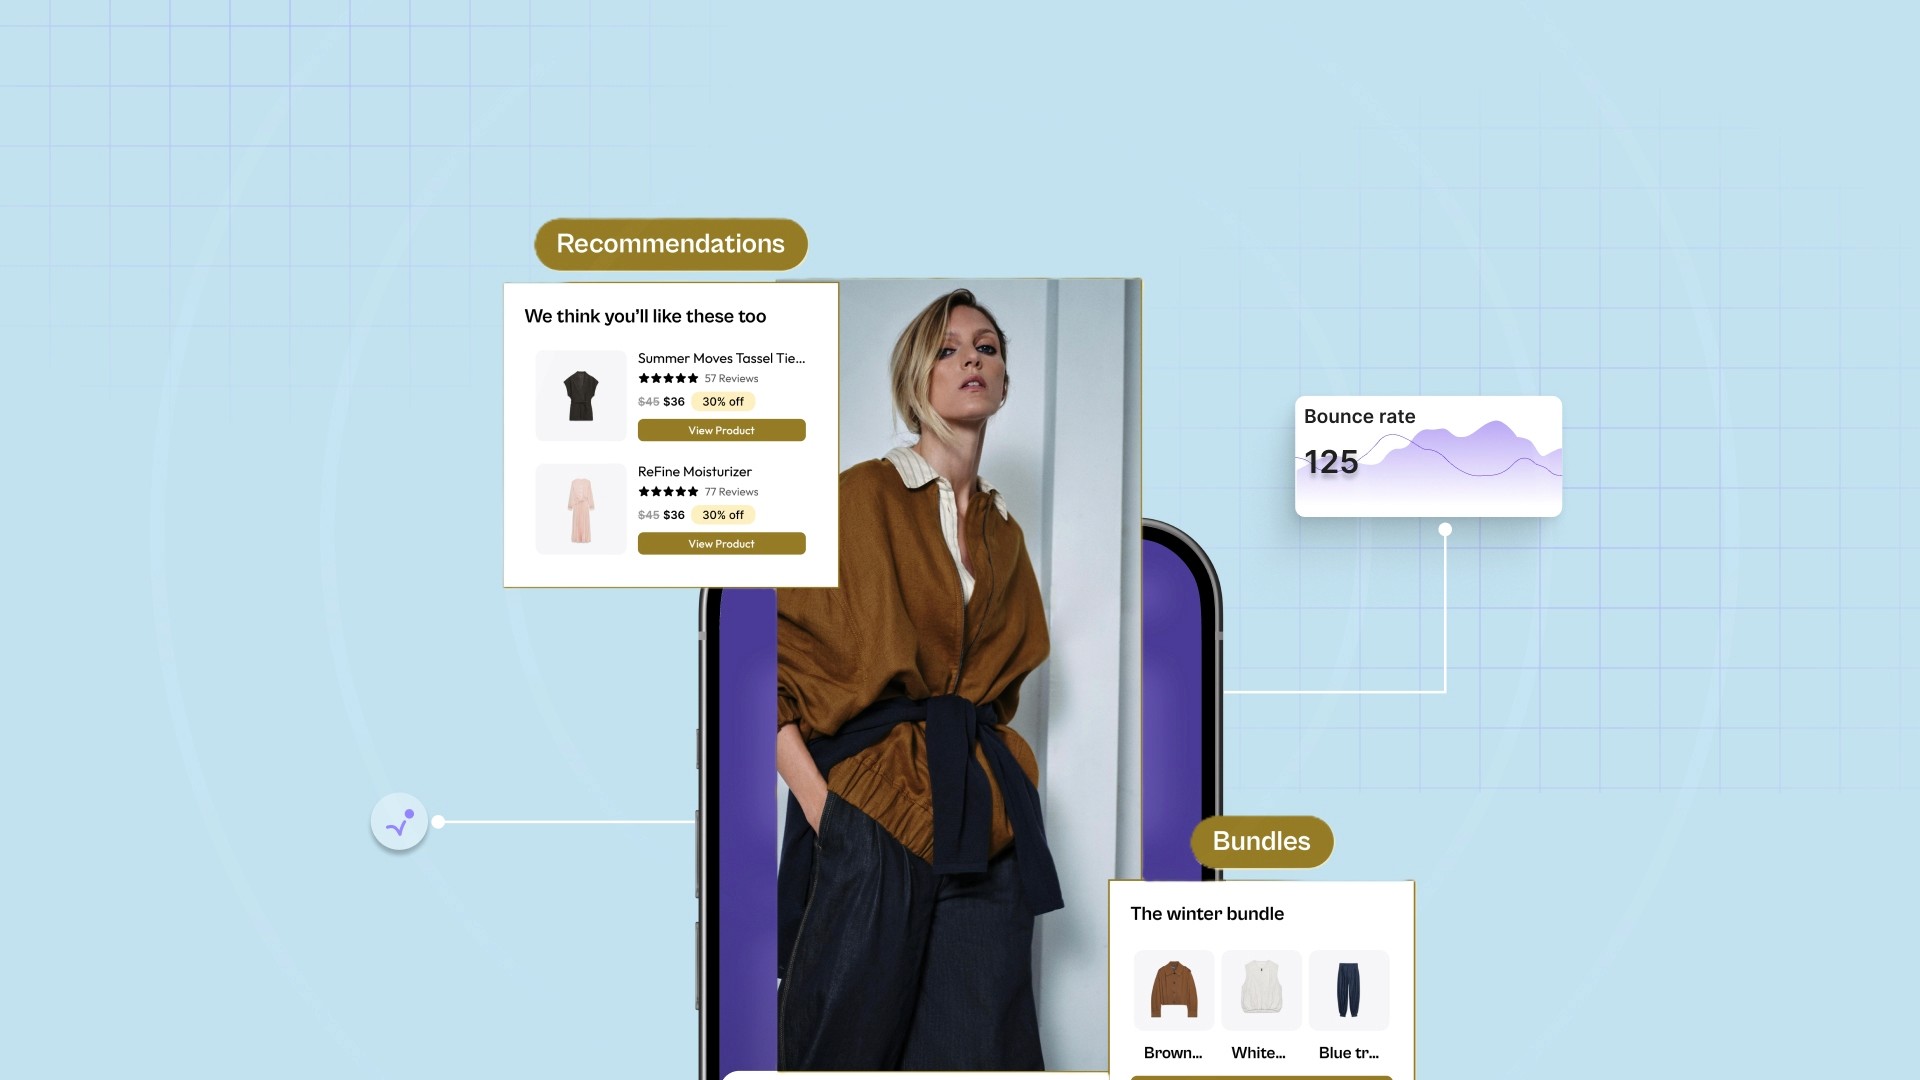
That's where Nudge helps. It enables real-time personalization across the funnel, powers AI Product Recommendations based on user behavior, and delivers Contextual Nudges that keep shoppers engaged from the first click to checkout.
Once you’ve optimized your site to reduce bounce rate, the next step is to measure the real impact.
Key Engagement Metrics to Track Alongside Bounce Rate
While bounce rate shows who left early, it doesn't reveal why they left or how others engaged before exiting. To get the full picture, you need to track additional engagement metrics that show the quality of each interaction. These indicators help you connect engagement improvements to actual conversion outcomes.
Key Metrics to Track:
Engaged Sessions: Measures visitors who stay for at least 10 seconds, trigger a conversion, or view multiple pages, showing true interest beyond surface clicks.
Average Engagement Time: Tracks how long users interact with your site content; longer durations often signal stronger product relevance or smoother UX.
Scroll Depth: Reveals how far users go down the page and whether they're consuming critical information like offers or CTAs.
Conversion Rate: Indicates what percentage of visitors complete desired actions such as purchases, signups, or downloads.
Exit Rate: Identifies the percentage of users leaving from a specific page, helping you find friction points within the browsing journey.
Pages per Session: Highlights how many pages an average visitor views, signaling overall content stickiness and site exploration depth.
Each of these metrics adds context to bounce rate, helping you move from isolated numbers to actionable insights.
Read Next: Proven Tips to Convert Leads Into Sales
How Can Nudge Help You Reduce Bounce Rate and Improve Conversions?
Nudge is the autonomous experience layer for modern e-commerce. It replaces static, one-size-fits-all pages with real-time, AI-composed journeys built for every individual shopper.
Much like TikTok's For You feed, Nudge turns each session into a personalized storefront, adapting layouts, offers, and content instantly while marketers launch and iterate without relying on dev cycles.
How Nudge Helps
Real-time personalization across the funnel: Adjusts homepages, landing pages, PDPs, PLPs, carts, and checkout in real time to match each shopper's behavior and intent.
AI Product Recommendations: Surfaces context-aware items and bundles that keep users exploring longer and raise average order value.
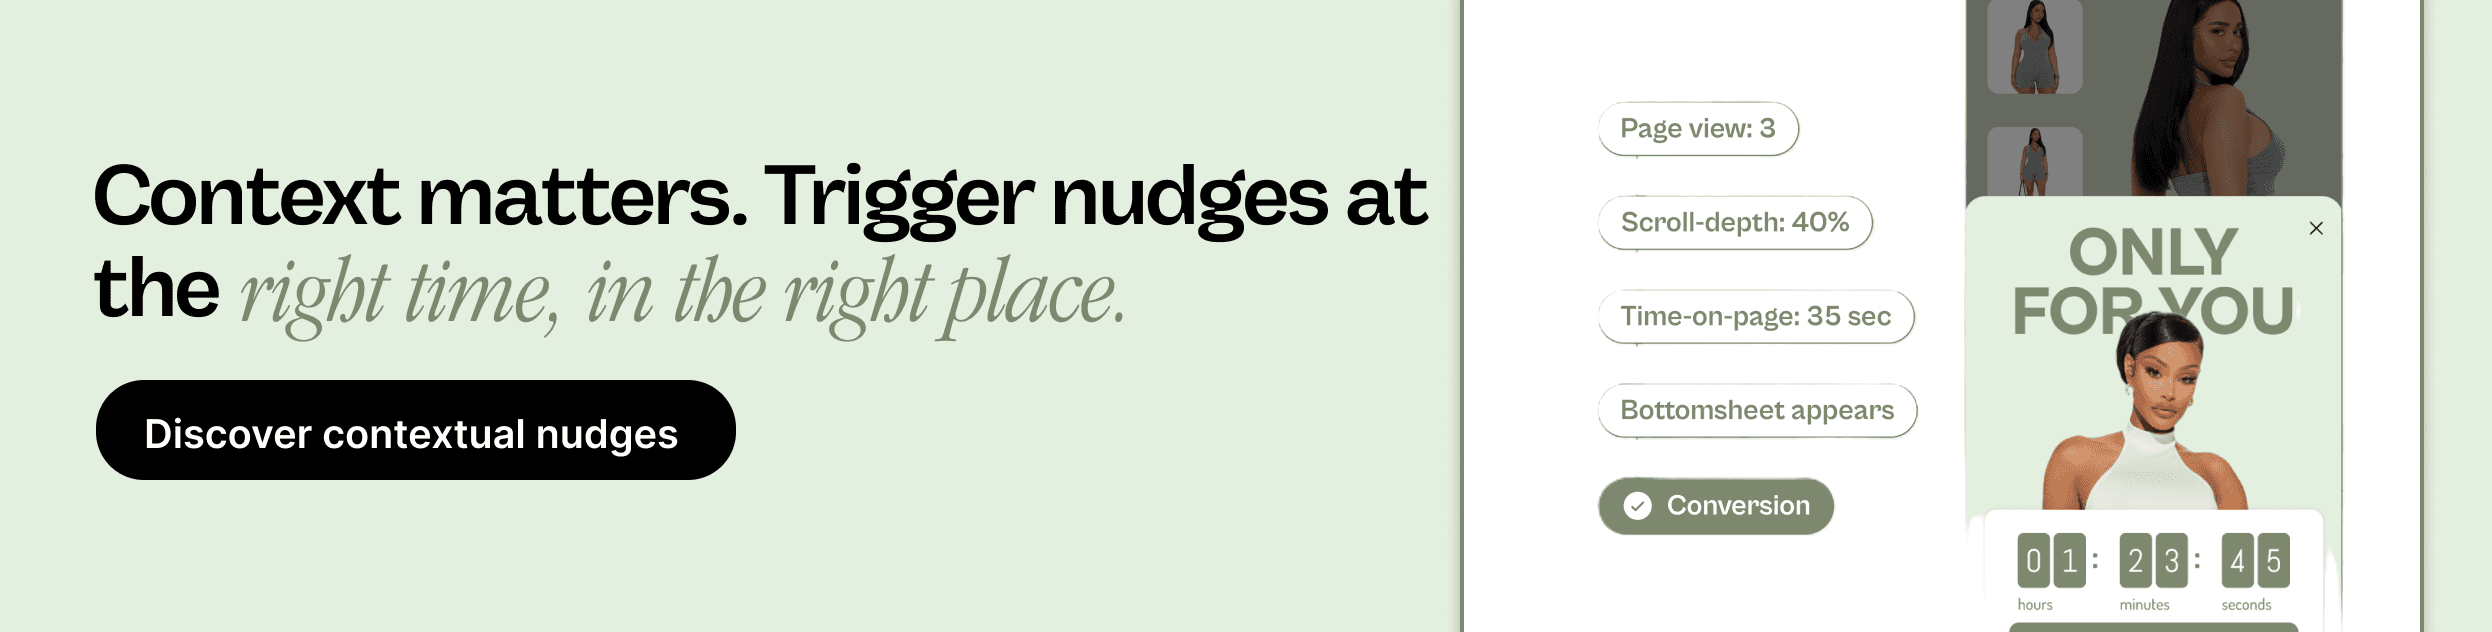
Contextual Nudges: Displays dynamic banners or modals based on scroll depth, exit intent, or time-on-page to re-engage distracted visitors.
Commerce Surfaces: Builds adaptive landing experiences featuring personalized product grids, shoppable videos, and dynamic offers.
Cart Abandonment Recovery: Sends targeted prompts and incentives to win back users who abandon their cart before completing checkout.
No-code deployment: Empowers marketers to test and refine experiences quickly, without engineering dependency.
Continuous learning: Uses feedback from every interaction to keep personalization smarter and conversions steadily improving.
By transforming static pages into responsive, data-driven experiences, Nudge keeps shoppers engaged longer, lowers bounce rate, and turns each visit into measurable revenue growth.

Wrapping Up
Understanding how to calculate bounce rate is the first step toward improving user engagement and conversions. When you interpret it correctly, optimize for relevance, and track supporting metrics, bounce rate becomes more than a percentage; it becomes a signal for better user experiences and higher ROI.
With Nudge, you can take this one step further. Its real-time personalization, AI Product Recommendations, and Contextual Nudges help reduce bounce rate and create meaningful, conversion-focused journeys for every visitor.
Want to know how Nudge can turn your bounce rate into lasting engagement and measurable growth? Book a demo today and experience personalization that converts every visit into a win.
FAQs
1. What is a good bounce rate for e-commerce websites in 2025?
A healthy bounce rate for most e-commerce sites in 2025 typically falls between 30% and 50%, depending on category and traffic source. Anything above that suggests issues with relevance, speed, or personalization.
2. Does a high bounce rate always mean my website is performing poorly?
Not necessarily. A high bounce rate on content-driven pages like blogs can be normal if users get what they need. It becomes a problem only when high-value pages like landing or checkout pages show similar patterns.
3. How can GA4 data help improve bounce rate analysis?
GA4 tracks engaged sessions instead of just single-page visits, giving a more accurate view of user interest. It helps you distinguish between visitors who leave instantly and those who spend time but don't convert.
4. Can personalization really reduce bounce rate for online stores?
Yes. Personalized landing pages and recommendations improve relevance and engagement. Shoppers who see content aligned with their intent are far more likely to stay, explore, and complete a purchase.
5. How does Nudge help reduce bounce rate and increase conversions?
Nudge uses real-time personalization, AI product recommendations, and contextual nudges to make every session feel uniquely relevant. This keeps users engaged longer, reduces bounce rate, and increases the chances of conversion.